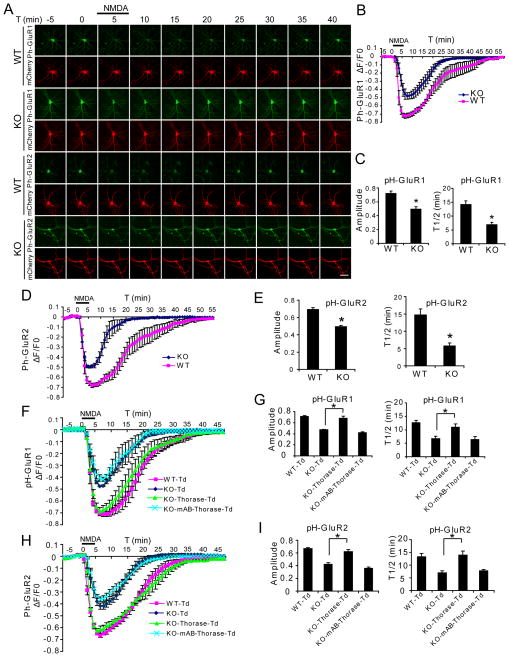
Figure 4. NMDA-induced AMPAR Internalization is Reduced in an ATPase-Dependent Manner in Thorase KO Neurons.
(A) Representative images of hippocampal neurons transfected with pHluorin (pH)-GluR1 or pH-GluR2 and mCherry subjected to a NMDA (20 μM, 5 min)/washout cycle. Scale bar = 50 μm.
(B) Time trace of pH-GluR1 fluorescence change in response to NMDA perfusion for the experiment presented in (A) (Mean ± SEM, n = 6 neurons for each experimental group from three individual experiments).
(C) Maximum amplitudes of pH-GluR1 fluorescence intensity changes to NMDA stimulation and average recycling half time (T1/2, the time taken from maximum endocytosis to 50% recycling) after NMDA washout (mean ± SEM, n = 6 neurons from 3 experiments. *p < 0.01, compared with WT neurons, Student’s t-test).
(D) Time trace of pH-GluR2 fluorescence change in response to NMDA perfusion for the experiment presented in (A).
(E) Maximum amplitudes of pH-GluR2 fluorescence changes to NMDA and T1/2 after NMDA washout (Mean ± SEM, n = 6 neurons from 3 experiments. *p < 0.01, compared with WT neurons, Student’s t-test).
(F) Fluorescence changes for pH-GluR1 in hippocampal WT and KO neurons transfected with tdTomato (Td), Thorase-Td or mAB-Thorase-Td during NMDA perfusion/washout experiments.
(G) Maximum amplitudes of pH-GluR1 fluorescence changes to NMDA and T1/2 after NMDA washout (Mean ± SEM, n = 5 neurons from 3 experiments. *p < 0.01, two way ANOVA with Tukey-Kramer post-hoc test).
(H) Fluorescence changes for pH-GluR2 in hippocampal WT and KO neurons transfected with Td, Thorase-Td or mAB-Thorase-Td during NMDA perfusion/washout experiments.
(I) Maximum amplitudes of pH-GluR2 fluorescence changes to NMDA and T1/2 after NMDA washout (Means ± SEM, n = 5 neurons from 3 experiments. *p < 0.01, two-way ANOVA with Tukey-Kramer post-hoc test).
See also Figure S3.

