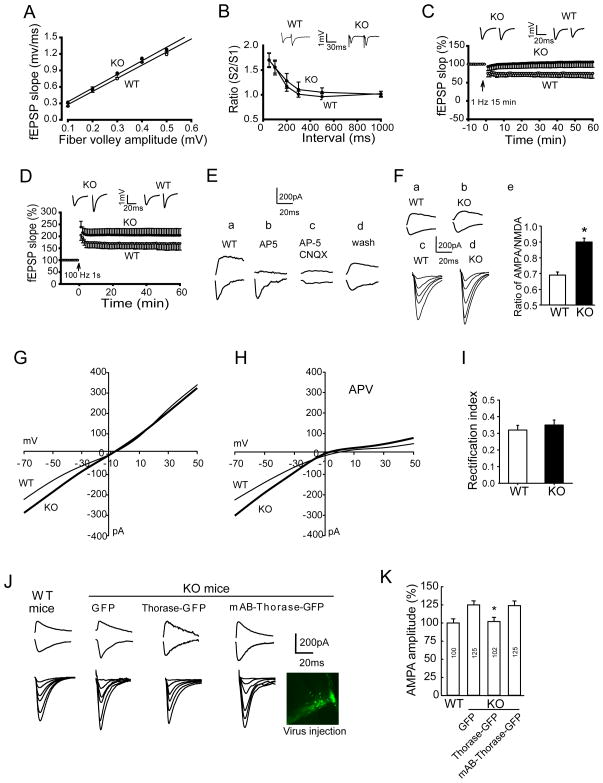
Figure 6. Thorase Deficiency Enhances AMPAR Currents and LTP and Impairs LTD Without Affecting Basal Synaptic Transmission at CA1 Hippocampal Synapses.
(A) Thorase KO CA1 neurons exhibit normal basal synaptic transmission. The amplitude of the fiber volley is plotted against fEPSP slopes. The input/output curves for neurons in slices from WT (n = 8 slices, 8 mice) or KO (n = 6 slices, 6 mice) were not significantly different (p > 0.05, Student’s t-test).
(B) Thorase KO does not affect paired-pulse facilitation (PPF) (WT, n = 8 slices, 6 mice; KO, n = 12 slices, 8 mice) (p > 0.05, Student’s t-test).
(C) Thorase is necessary for LTD induction. LTD was induced by 1 Hz stimulation in slices from WT mice, but not in slices from Thorase KO mice.
(D) Thorase is a negative regulator of LTP. LTP was induced by a tetanic train (100 Hz, 1 s). The magnitude of LTP for slices from KO mice was significantly greater than that for WT mice (KO, n = 8 slices from 4 mice; WT, n = 6 slices from 3 mice. p < 0.01, Student’s t-test).
(E) NMDA and AMPA currents recorded at 40 mV and −70 mV, respectively, in CA1 neurons of slices from WT mice that were (a) untreated, (b) treated with AP-5, (c) treated with AP-5 plus CNQX or (d) treated with AP-5 plus CNQX followed by a 30 minute washout.
(F) NMDA and AMPA currents recorded in slices from (a) WT and (b) KO mice. EPSC input/output relations recorded in slices from (c) WT and (d) KO mice. (e) Histogram of averaged AMPA/NMDA ratio (n = 6; *p < 0.05, Student’s t-test).
(G) I-V curves from WT (thin line) and KO (thick line) mice. Values are the mean of measurements made in 8–10 neurons in 8–10 slices. p < 0.05, Student’s t-test.
(H) I-V curves for slices from WT and KO mice incubated in the presence of AP-5 (8–12 neurons in 8–10 slices). p < 0.05, Student’s t-test.
(I) The rectification index measured by dividing the EPSC amplitude at +40 mV by that at −70 mV shows no significant difference between WT and KO mice.
(J and K) AMPA currents of CA1 pyramidal neurons in brain slices from KO mice are restored to normal by lentiviral-mediated overexpression of Thorase (8–12 neurons in 8–10 slices). *p < 0.05, Student’s t-test compared to the GFP and mAB-Thorase-GFP values.
See also Figure S4.

