
Figure 1.
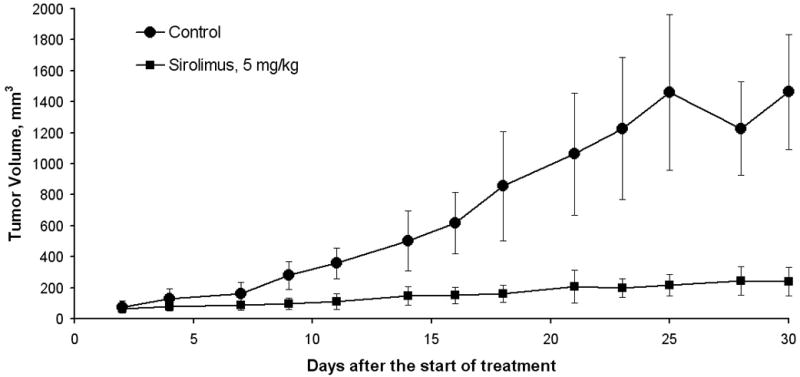
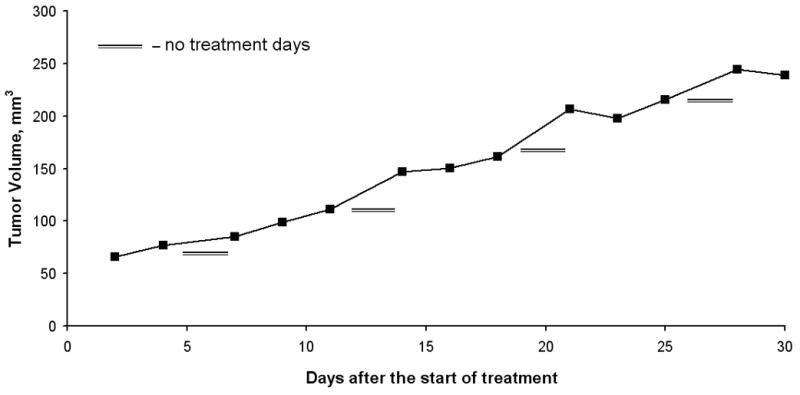
A, Tumor growth curve in the minimal residual disease model comparing sirolimus to control, revealing a significant difference in tumor growth inhibition in the sirolimus treated group. B, Tumor growth curve: volume growth rates (mm3 per mouse per day) increased on “no treatment” days, resulting in growth “spikes” in the sirolimus treatment group.