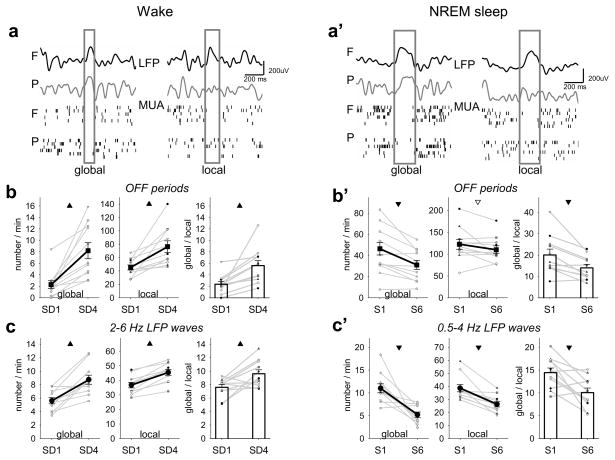
Figure 2. Local wake OFF periods.
a, top: wake LFP records in frontal (F) and parietal (P) cortex, depicting global or local frontal 2–6 Hz waves (boxed); bottom, raster plots of corresponding MUA. a′, top: LFP records in NREM sleep depicting global or local frontal slow waves (boxed); bottom: raster plots of corresponding MUA. b, left and middle: change in global and local OFF periods during sleep deprivation (mean, n=7 rats, 1–3 experiments/rat). Triangles here and in the next panels depict differences at a significant (filled) or tendency (open) level (global OFF periods: F(1,21)=94.95, p=0.0104; local OFF periods: F(1,21)=20.08, p=0.0464). Right: number of global OFF periods (as % of local, F+P) during SD1 and SD4 (F(1,21)=67.05, p=0.0146, fixed-effects model ANOVA). b′, left and middle: change in global and local OFF periods during NREM sleep (mean, n=7 rats, 1–3 experiments/rat; global OFF periods: F(1,21)=60.72, p=0.0161; local OFF periods: F(1,21)=11.56, p=0.0767). Right: number of global OFF periods (as % of local, F+P) during S1 and S6 (F(1,21)=99.17, p=0.0099, fixed-effects model ANOVA). Note different Y-axis scale in b and b′. c, left and middle: changes in global and local waves from SD1 to SD4 (mean, n=7 rats, 1–3 experiments per rat, SEM; global waves: F(1,21)=34.08, p=0.0281; local waves: F(1,21)=28.54, p=0.0333). Right: number of global waves (as % of local, F+P) during SD1 and SD4 (F(1,21)=52.53, p=0.0185, fixed-effects model ANOVA). c′, left and middle: changes in global and local waves during NREM sleep (mean, n=7 rats, 1–3 experiments/rat, SEM; global waves: F(1,21)=254.42, p=0.0039; local waves: F(1,21)=529.31, p=0.0019). Right: number of global waves (as % of local, F+P) during S1 and S6 (F(1,21)= 37.38, p=0.0253, fixed-effects model ANOVA). Note different Y-axis scale in c and c′.

