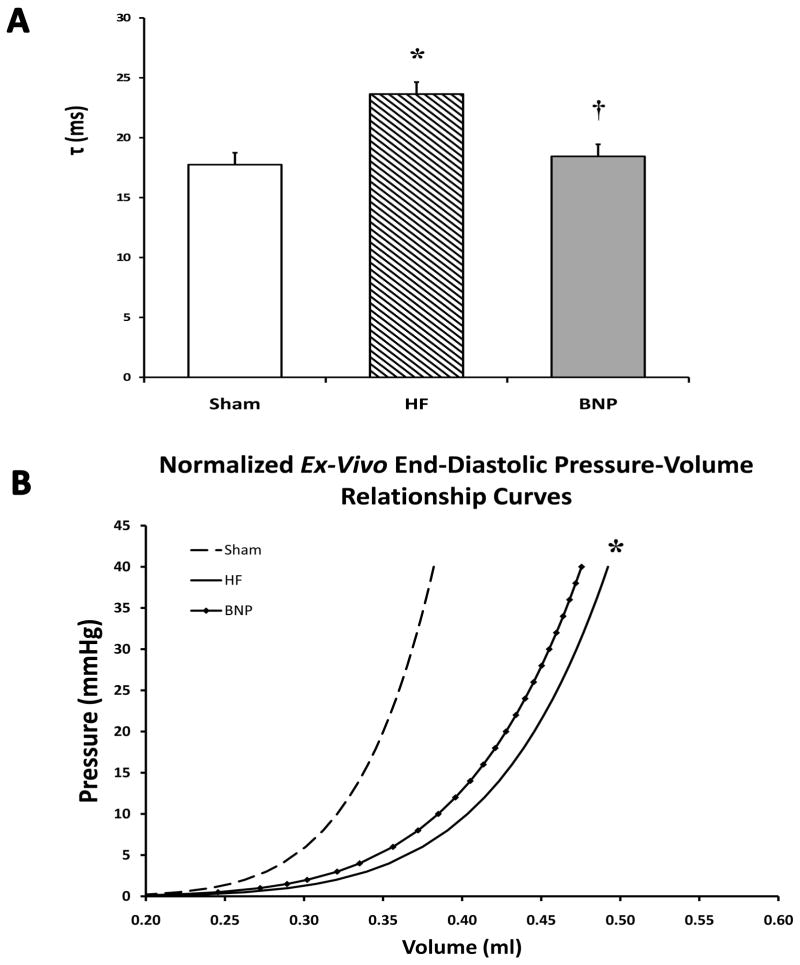
Figure 3.
Pressure-Volume Analysis. In Panel A, τ, the isovolemic ventricular relaxation constant, was significantly lower in the BNP group vs HF rats and comparable to Sham rats. In Panel B, ex-vivo EDPVR curves demonstrate an attenuated shift to the right after BNP therapy vs. Sham. HF rats had a slightly greater shift to the right, representative of worsened diastolic properties, that was also confirmed on in-vivo pressure-volume analysis. (* p<0.05 vs. Sham, † p<0.05 vs HF)

