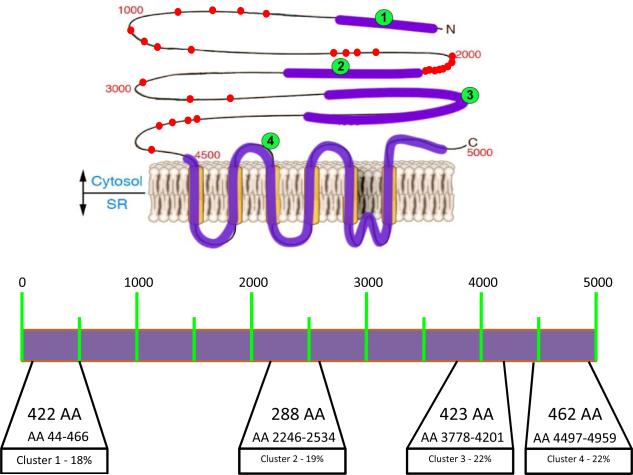
Figure 4.
Cartoon (upper panel) and schematic representation (lower panel) of the RyR2 protein. Clusters with frequent mutations are depicted with their location along RyR2 amino acid (AA) sequence. Percentage of known (published) mutation for each cluster is also reported (lower panel). Mutation outside the canonical clusters are depicted as dots (upper panel). Each dot represents a unique mutation.

