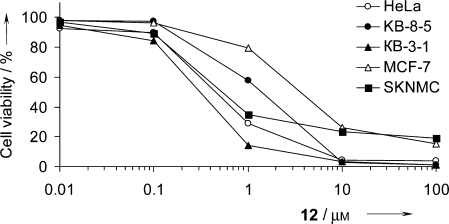
Figure 2.

Dose–response curves for 12 with different human cancer cell lines. Cells were incubated for 24 h with increasing concentrations of 12 (0.1 to 100 μm). Cell viability was measured by the MTT assay as described in the Experimental Section. The results are expressed as percentages of viable cells observed after treatment, relative to control cells (100 %) incubated in the presence of DMSO (0.1 % (v/v)). Data were obtained from three separate experiments in triplicate.
