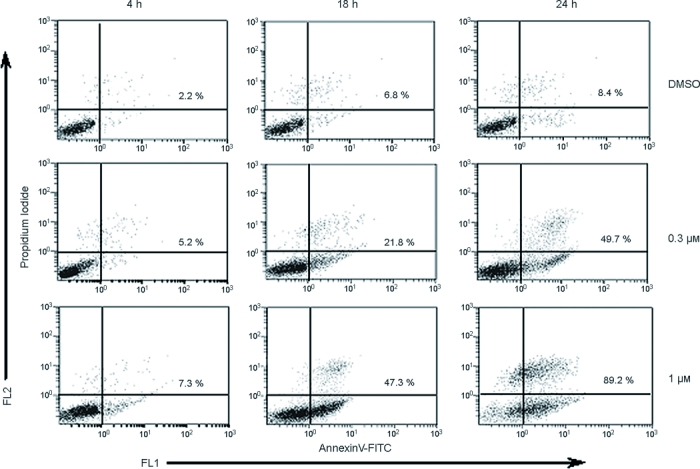
Figure 5.

Quantification of apoptosis by annexin V binding to KB-3-1 cells. Cells were incubated in the presence of 0.3 or 1 μm 12, or in the presence of 0.1 % (v/v) DMSO for the indicated times. Annexin V binding was carried out with the Annexin V–FITC detection kit as described in the Experimental Section. Annexin V/PI staining was analyzed by flow cytometry. The lower-right quadrant of each cytometry scattergram shows the annexinV+PI− cells; the upper-right quadrant shows the annexinV+PI+ cells. The results are representive of one of three independent experiments.
