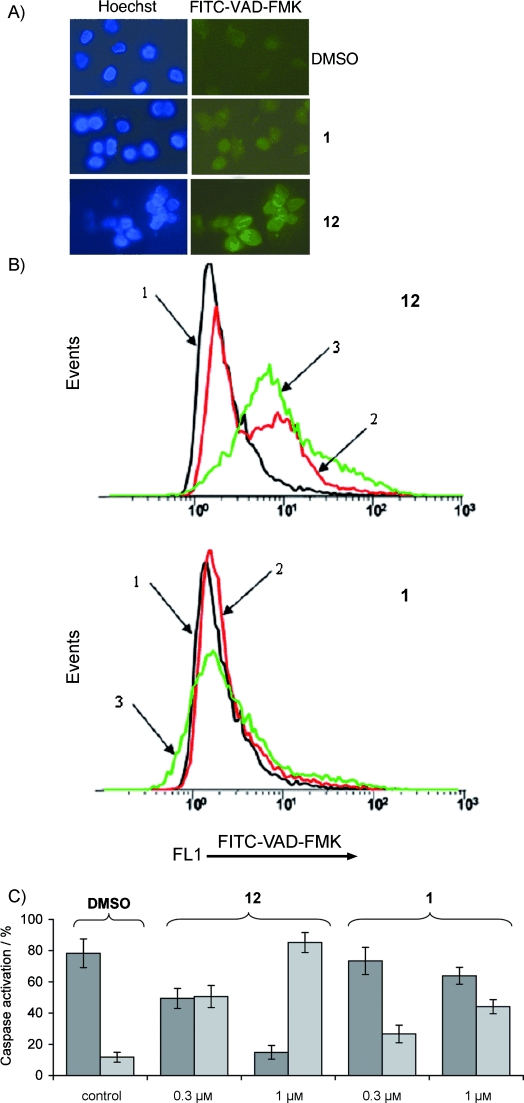
Figure 7.

Induction of caspase activation in human cancer cells. A) Fluorescence microscopy of FITC-VAD-FMK in living KB-3-1 cells incubated for 18 h with 0.3 μm 1 or 12. Cells were counter-stained with Hoechst dye. B) Flow cytometry analysis of the activation of proteins of the caspase family. Cytograms of FITC-VAD-FMK in living cells incubated with 1 or 12. KB-3-1 cells without treatment (1), treated with 0.3 μm (2) and 1 μm (3) of the indicated compounds (18 h incubation). C) Percentages of cells undergoing apoptosis (staining positive for FITC-VAD-FMK). Percentage of cells with non-activated (▪) and activated (▪) caspases after treatment with the indicated concentrations of 1, 12 or DMSO (0.1 % (v/v), control). Error bars indicate standard deviation.
