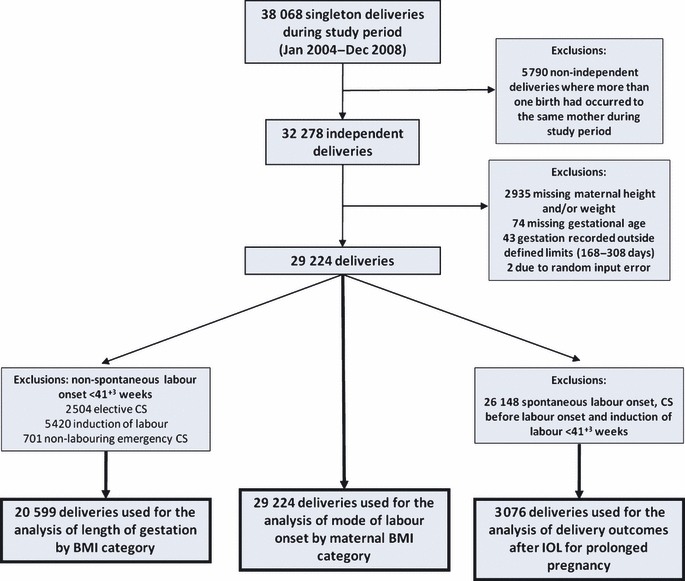
Figure 1.

Number of singleton deliveries during the study period and the application of exclusion and inclusion criteria for each study sample.

Number of singleton deliveries during the study period and the application of exclusion and inclusion criteria for each study sample.