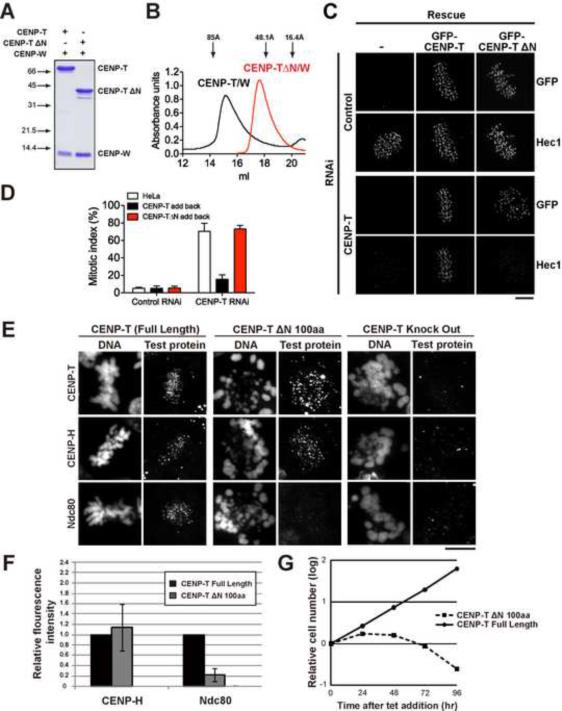
Figure 2. The CENP-T N-terminus is required kinetochore assembly.
(A) Coomassie-stained gel showing bacterially purified recombinant full length 6xHis-CENP-T/CENP-W or CENP-T-ΔN/CENP-W, lacking aa 1–288. (B) Graph showing the elution profile (OD280) of recombinant CENP-T/W complex and CENP-T-ΔN/W on a Superose 6 size exclusion column. Arrows indicate the migration of standards with known Stokes radii: Thyroglobulin (85 Å), Aldolase (48.1 Å) and RNase A (16.4 Å). (C) Immunofluorescence images showing levels of Hec1/Ndc80 48 h after RNAi depletion of CENP-T in HeLa cells or HeLa cell lines expressing RNAi resistant GFP-CENP-T or GFP-CENP-T-ΔN. Scale bar, 5 μm. (D) Graph showing quantification of the mitotic index 48 h after RNAi depletion of CENP-T in HeLa cells, or HeLa cell lines expressing RNAi resistant CENP-T or CENP-T ΔN. N=100 cells, +/− SEM. (E) Representative immunofluorescence images of chicken DT40 cells after depletion of endogenous CENP-T and expression of the indicated protein fragments. Scale bar, 10 μm. (F) Quantification of kinetochore intensity after depletion of CENP-T and expression of the indicated proteins. N = 200, +/− SD. (G) Graph showing viability of CENP-T conditional-depletion in DT40 cells expressing the indicated proteins after addition of tetracycline. Also see Fig. S2.

