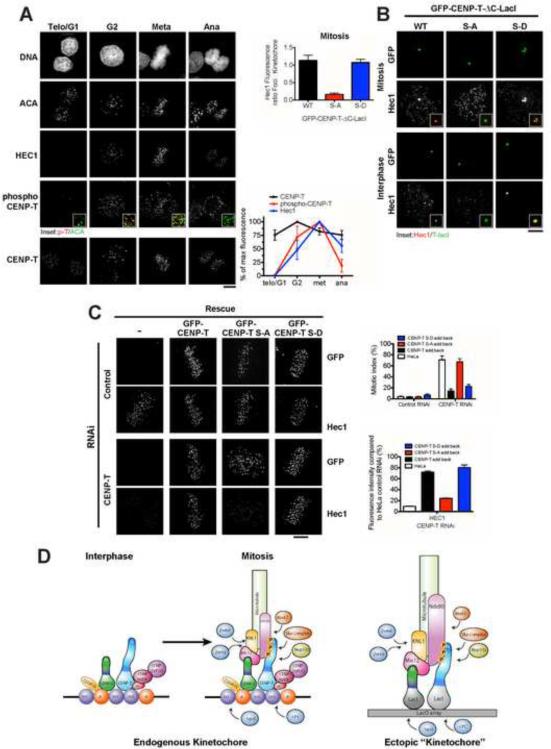
Figure 7. Mitotic kinetochore assembly is regulated by phosphorylation of CENPT by CDK.
(A) Immunofluorescence images of Hela cells at the indicated cell cycle stages. Right panel shows quantification of CENP-T, phospho-CENP-T and Hec1 levels at centromeres, N ≥ 10 cells/condition, 20 kinetochores/cell, +/− SEM. Scale bars, 5 μm. (B) Immunofluorescence images showing levels of Hec1/Ndc80 at ectopic foci in mitotic and interphase U20S LacO cells expressing LacI fusions of: GFP-CENP-T, GFP-CENPT S-A (S or T to A mutations at amino acids 11, 27, 47, 85 and 195), or GFP-CENP-T S-D (S or T to D mutations at amino acids 11, 27, 85). Graph shows the relative fluorescence of Hec1/Ndc80 at kinetochores versus ectopic foci, in mitotic cells expressing the indicated CENP-T LacI fusion proteins. Quantification was done after 15 h nocodazole treatment, N ≥ 10 cells/condition, 20 kinetochores/cell, +/− SEM. Data is shown normalized to the foci/kinetochore ratio of CENP-T. (C) Left panels: Immunofluorescence images showing levels of Hec1/Ndc80 48 h after RNAi depletion of CENP-T in HeLa cells or HeLa cell lines expressing RNAi resistant GFP-CENP-T, GFP-CENP-T S-A or GFP-CENP-T S-D. Right panels: Quantification of mitotic index and Hec1/Ndc80 levels, after RNAi depletion of CENP-T and add back of the indicated GFP-CENP-T proteins, +/− SEM. (D) Model depicting interactions at endogenous and ectopic kinetochores. Also see Fig. S6.

