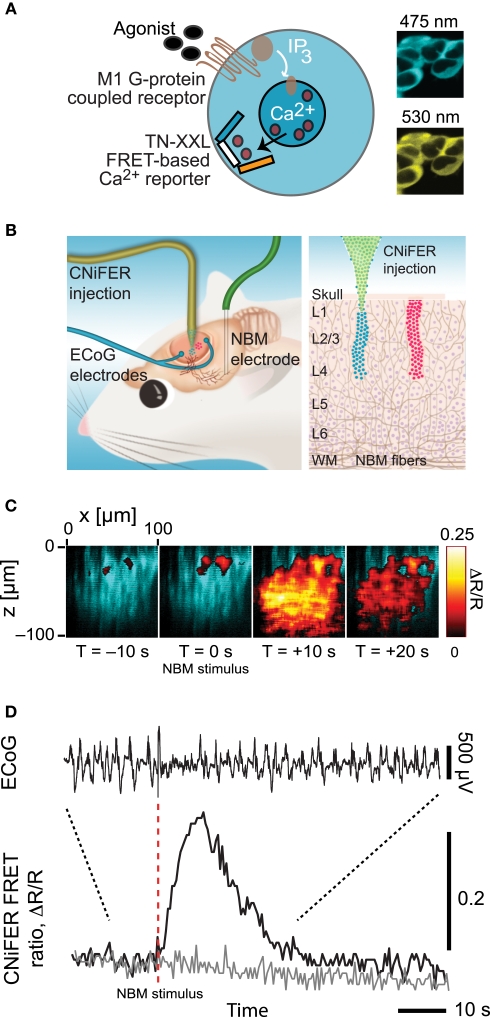
Figure 4.
Overview of CNiFER methodology. (A) Schematic of the cell-based sensors with a Gq family, G-protein coupled receptor for acetylcholine and the TN-XXL genetically expressible calcium reporter. (B). Cartoon of the injection of CNiFERs and the placement of microelectrodes in rat frontal cortex. (C) In vivo response of M1-CNiFERs to cholinergic input after electrical activation of nucleus basalis (NBM). The X–Z scan was obtained with TPLSM through the depth of cortex before and after activation of cholinergic neurons in NBM. (D) Time dependence of the M1-CNiFER response, together with control data from CNiFERs without the M1 receptor, and the electrocorticogram (ECoG). The decrease in amplitude of the ECoG after stimulation, as expected for cholinergic activation of cortex. Adapted from Nguyen et al. (2010).

