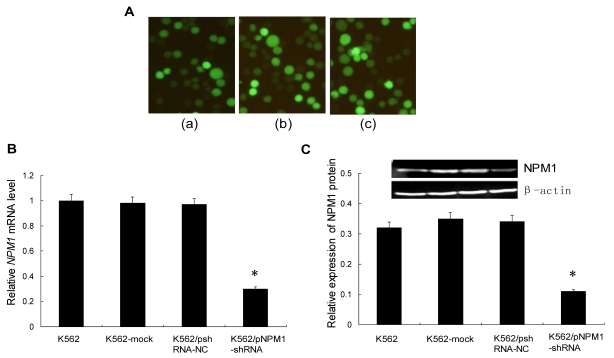
Figure 1.
Transfection of the interference vectors and effect of NPM1 gene silencing on NPM1 expression. A, The expression of GFP protein in transfected cells was detected by fluorescence microscopy (×200). (a), K562-mock cells; (b), K562/pshRNA-NC cells; (c), K562/pNPM1-shRNA cells. A representative example of this transfection results is shown. B, The level of NPM1 mRNA expression was detected by qRT-PCR. The expression of NPM1 mRNA in K562/pNPM1-shRNA cells was significantly decreased compared with the control groups. Data are shown as means ± SD of triplicate experiments. *p <0.05. C, The level of NPM1 protein expression was assessed by Western blot. The average signal intensity was standardized to β-actin. The expression of NPM1 protein in K562/pNPM1-shRNA cells was significantly decreased compared with the controls. Data were shown as means ± SD of triplicate experiments. *p <0.05.

