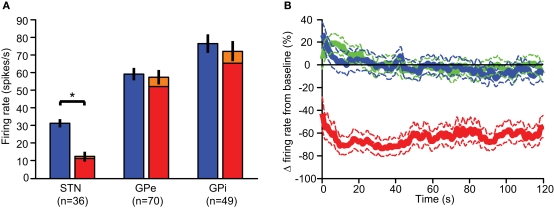
Figure 3.
Neuronal firing rate. (A) The mean firing rates for the periods prior to stimulation (blue), during stimulation (red), and NP compensated (orange) in the STN, GPe, and GPi. Error bars represent SEM (* p << 0.01 ). (B) The firing rate dynamics during the stimulation relative to the baseline rate of the STN (red), GPe (green), and GPi (blue); dashed lines represent the SEM.

