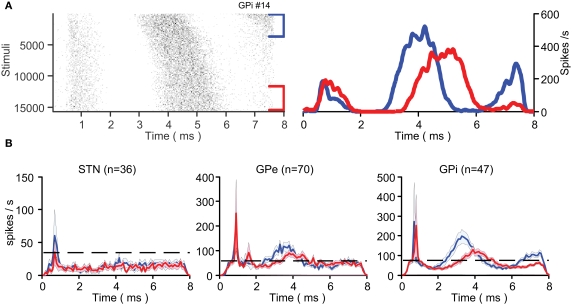
Figure 5.
Response dynamics. (A) An example of a single neuron's change in response to the stimulation presented in a raster plot (left) and PSTH (right). The first (blue) and last (red) 30 s of the stimulation are presented separately. (B) Mean population PSTH (mean ± SEM) over the first (blue) and last (red) 30 s of stimulation across all nuclei. The dashed line represents population baseline rate prior to stimulation.

