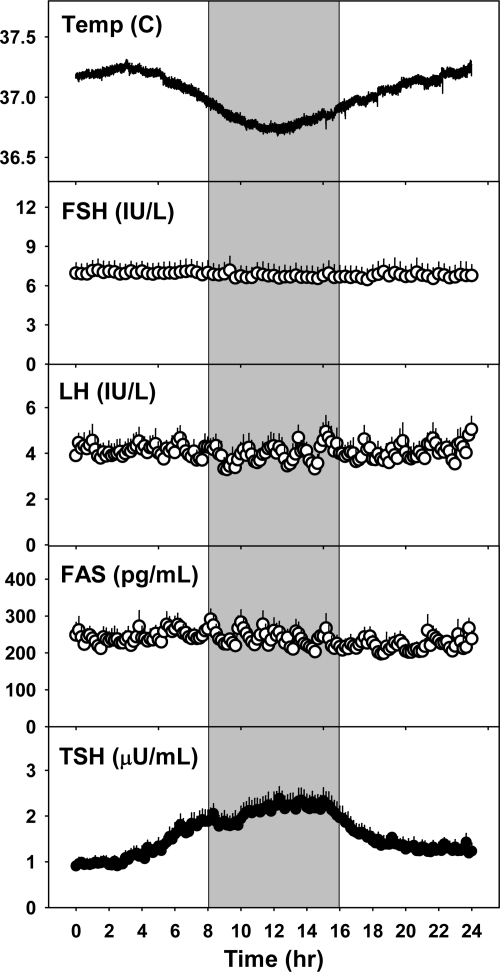
Fig. 2.
Mean + sem of temperature, FSH, LH, FAS, and TSH levels (n = 11). The gray shaded area represents subjects' habitual sleep time, during which they were kept awake for the constant routine. Temperature and TSH are best fit with a sinusoidal model, whereas FSH, LH, and FAS are best fit with a linear model.

