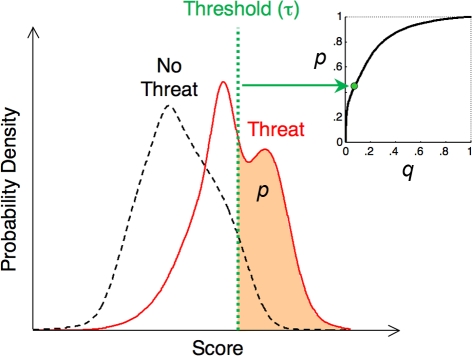
Figure 2.
Connection between ROC curves (p vs. q) and probability distributions. The probability distributions of some “score” parameter, conditioned on the presence (solid curve) or absence (dashed curve) of a threat are shown. A possible interpretation for this score is that it is the output of a neural network that assesses all of the information available to the animal, in an attempt to infer the danger of a given object. One possible decision threshold, τ, is indicated, whereby the animal decides to flee from objects with scores above the threshold, and not to flee from those with scores below the threshold. By varying the threshold, the animal can alter the correct detection probability p, indicated by the area under the “threat” distribution (solid curve) to the right of the threshold; at the same time, varying the threshold also affects the false positive probability q, given by the area under the “no threat” distribution (dashed curve) to the right of the threshold. The same threshold determines both p and q; they are related by the ROC curve p = f(q) (inset).

