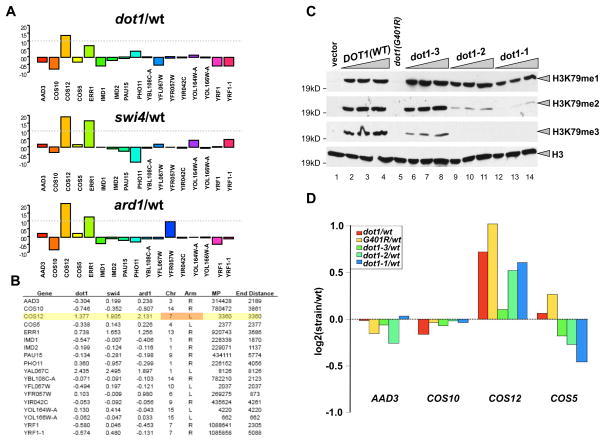
Figure 2. Histone H3K79 methylation effects on natural telomere-associated gene expression.
(A) The log2 ratio of gene expression for mutant/wt is shown for genes within 5kb of chromosomal ends. The dashed grey line indicates two-fold enrichment in the mutant over wt. (B) Table of gene expression values. The log2 ratio of gene expression for mutant/wt is shown for genes within 5kb of chromosomal ends for the mutants indicated in the table, along with the chromosomal position of the gene, the gene midpoint, and the distance between the midpoint and the end of the chromosome. (C) H3K79 methylation status in cells expressing dot1-1, dot1-2, and dot1-3 alleles were examined by Western blotting using anti-H3K79 mono-, di- and trimethylation specific antibodies. Dot1 alleles were cloned in pRS315 vector as described under Materials and Methods. Dot1 (G401R) is a catalytically dead mutant (van Leeuwen et al., 2002). dot1-3 exhibits slightly less accumulation of H3K79 trimethylation, but comparable levels of dimethylation than wild-type; while dot1-2 and -1 lost most of their H3K79 tri- and dimethylation with an observed slight loss in the H3K79 monomethylation signal in dot1-1. (C) Gene expression analysis using dot1-1, -2, and -3 strains. The ratio of gene expression in log2 format for various Dot1 mutants relative to wt is shown for four genes within 5 kb of the chromosomal ends.

