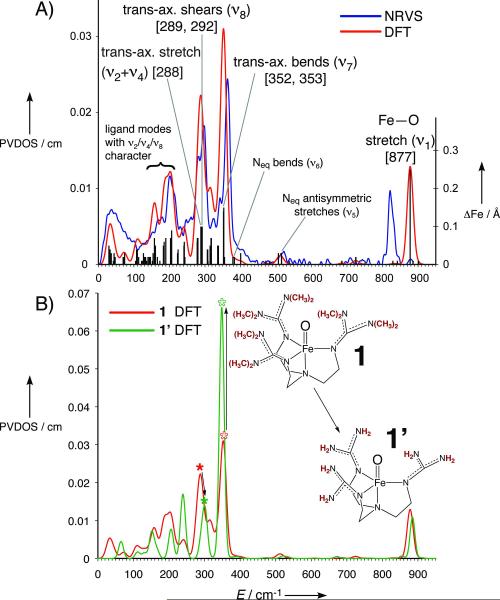
Figure 3.
A) DFT-calculated spectrum (red) of 1 overlaid with NRVS spectrum (blue) and ΔFe (black bars). Important normal mode assignments are labeled, with calculated energies in square brackets. B) Comparison of DFT-calculated spectra of 1 (red) and 1′ (green), with ν8 modes indicated by solid asterisks and ν7 modes indicated by hollow asterisks. Removing the steric wall transfers intensity from ν7 to ν8.

