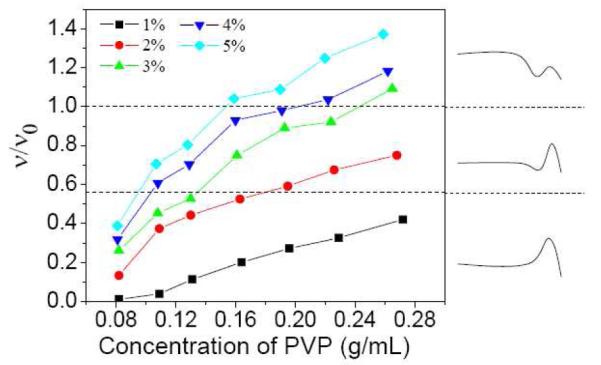
Figure 5.

Fraction of elastically active chains (ν/ν0) versus PVP concentration in DMSO for samples with different concentration of 1b. Dashed lines are used to connect the ν/ν0 with the steady shear behavior in Figure 4b. Types of steady shear behavior (see Scheme 1) are shown to the right of the graph for convenience. T = 25 °C.
