
Figure 6.
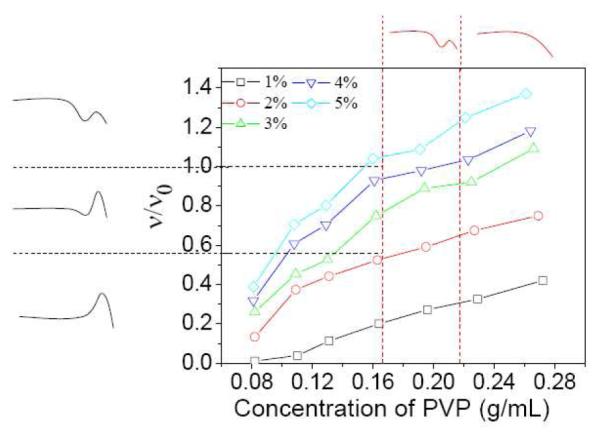
Fraction of elastically active chains (ν/ν0) versus PVP concentration in DMSO for samples with different concentration of 1a. Black dashed lines are used to connect the ν/ν0 with the steady shear behavior in Figure 4a. Red dashed lines are used to connect the PVP concentration with the steady shear behavior in Figure 4a. Types of steady shear behavior (see Scheme 1) are shown on the perimeter of the graph for convenience. T = 25 °C.