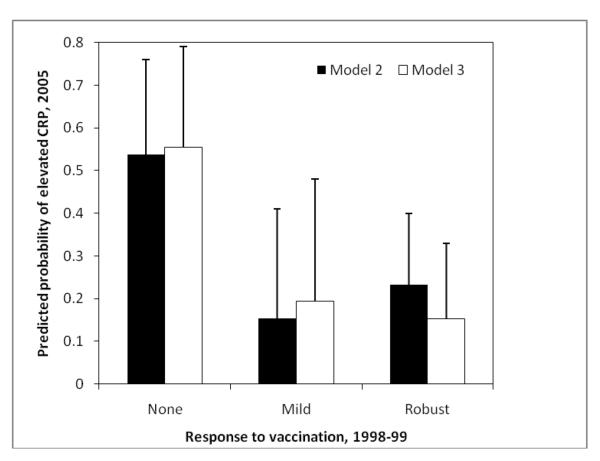
Figure 1.
Predicted probability of elevated CRP in 2005 in relation to vaccine response in 1998-99. Probabilities are based on regression coefficients from model 2 and model 3 in Table 2. Results for model 2 exclude individuals with CRP>10 mg/L at the time of blood collection, while results for model 3 also excluded individuals with symptoms of infection at the time of blood collection.

