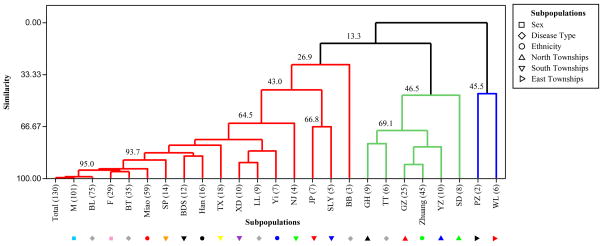
Figure 2. Similarity dendrogram for M. leprae genotypes in Qiubei.
The dendrogram is based on the distribution of allele frequencies for various subpopulation definitions: gender [male, female], clinical type [TT, BT, BB, BL and LL], township of residence [BDS, GH, GZ, JP, NJ, PZ, SD, SP, SLY, TX, WL, XD, YZ] and ethnicity [Zhuang, Miao, Han, Yi]. The number of cases for each subpopulation is shown in parenthesis.

