Figure 3.
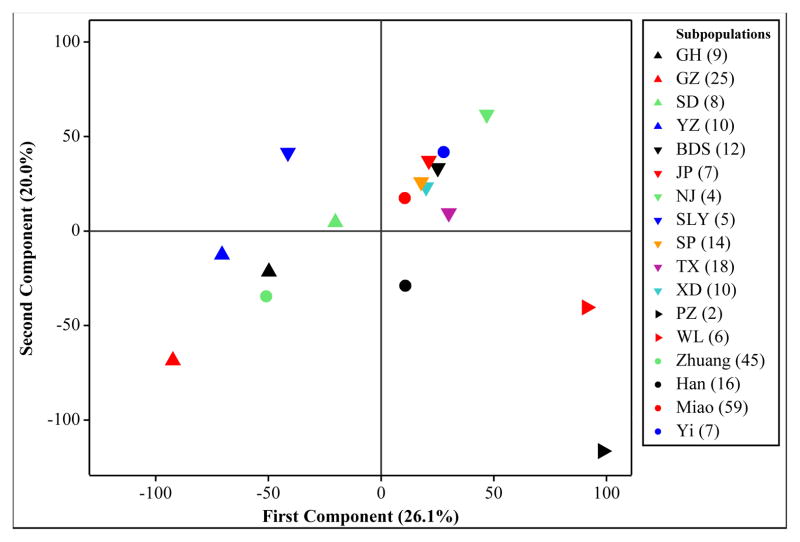
Figure 3A. The score plot for the first two principal components of M. leprae VNTR allele frequencies classified according to patient ethnicity and township
Colored arrowhead symbols have been used for each of the townships of the North, South and East regions with the direction of the arrowheads indicating region membership. The first two principal components account for 46.1% of the variation in the data.
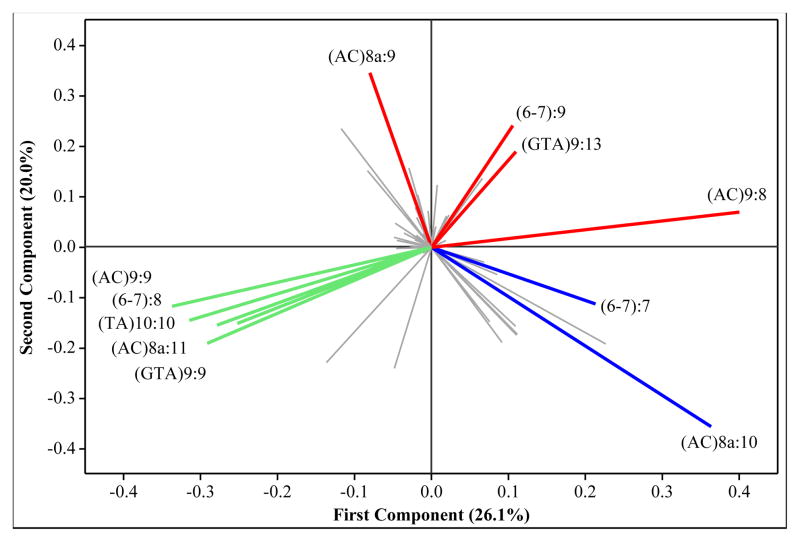
Figure 3B. The loading plot for the first two principal components of M. leprae VNTR allele frequencies classified according to patient ethnicity and township
The position of alleles on the loading plot corresponds to the location of townships and ethnicities on the score plot. Alleles with similar directionality are positively correlated, and the length of the projection line represents the magnitude of an allele’s contribution. Thus, those alleles that are most casual to the distribution seen on the score plot will show similar directionality from the origin when compared to subpopulations on the score plot. Here there are a large number of alleles clustered in the center. These alleles are not informative at the township or ethnicity subpopulation level, owing to lack of diversity or low overall frequency. The colors of the projections highlight alleles having higher frequencies in particular regions; East, North and South are shown in blue, green and red, respectively.


