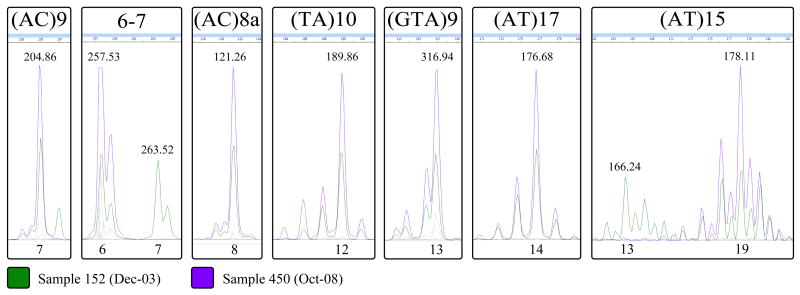
Figure 5. Fragment length analysis chromatograms for the relapse patient.
The two samples shown are from a single patient, the first (152) from initial diagnosis of leprosy and the second (450) from a second presentation approximately 5 years later. The relevant peaks are shown for each locus used in this study. Peak intensities have been adjusted for the sake of clarity, and non-informative dye colors have been grayed out. The size of each fragment, in base pairs, is listed above the dominant peaks. Copy number (allele) is listed below each peak. For loci 6–7 and (AT)15 multiple alleles are seen for sample 152. Inset within each allelic peak in sample 450 (purple, full-height) is a perfectly matched allele from sample 152 (green, half-height).

