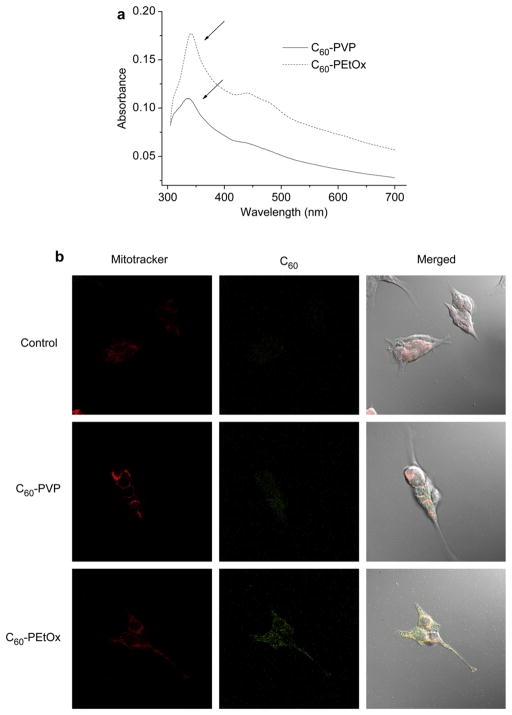
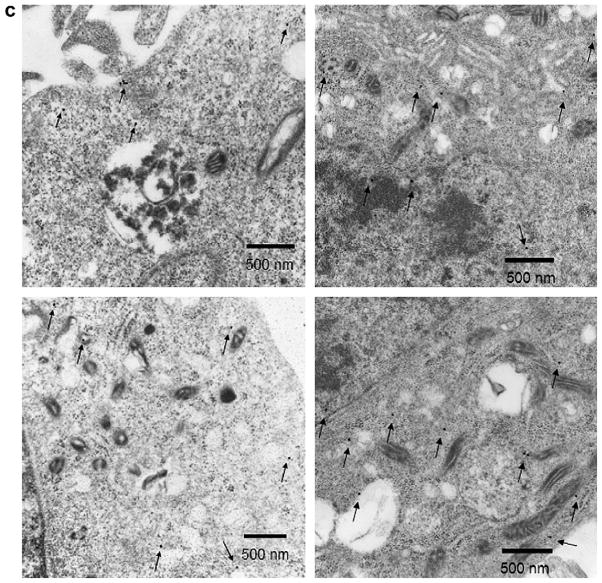
Fig. 7.
Neuronal uptake and sub-cellular distribution of fullerene after 24 h exposure of CATH.a neuronal cells to 100 μM in C60 of complexes. (a) UV–vis spectra of supernatant of cell lysates. The absorbance maximum of fullerene at 340 nm is marked by arrows. The absorbance was normalized by the cellular protein concentration determined by MicroBCA assay. The spectrum of the control group was subtracted. (b) Immunofluorescence images of CATH.a neuronal cells treated with C60-PVP or C60-PEtOx complexes. Cells untreated with C60-polymer complexes are shown for comparison. Mitochondria were stained with MitoTracker® Red (red fluorescence). Fullerene was detected with anti-fullerene antibody and then stained with Alexa Fluor® 488 labeled secondary antibody (green fluorescence). (c) TEM images of CATH.a neuronal cells treated with C60-PEtOx complex. Fullerene was detected with anti-fullerene antibody and 25 nm colloidal gold-labeled secondary antibody. The colloidal gold was marked by arrows.


