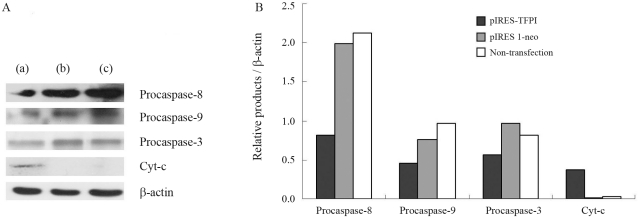
Figure 4.
Western blot analysis for procaspase-8, procaspase-9, procaspase-3, and cyt-c. (A) Representative data of Western blotting for pIRES-TFPI treated group (a), pIRES 1-neo treated group (b) and non-transfection group (c); (B) protein levels standardized by β-actin. *p < 0.05 as compared with the pIRES 1-neo group (n = 3).

