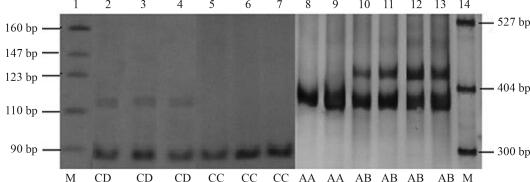
Figure 1.
Polyacrylamide gel electrophoresis (PAGE) profile for HaeIII digestion products of GH1 (AA and AB) and GH2 (CC and CD). Lanes 2 to 4 represent digestion products from samples with the CD genotype (116, 88 and 28 bp). Lanes 5 to 7 represent the CC genotype (88 and 28 bp). Lanes 8 and 9 represent the AA genotype (366 and 56 bp). Lanes 10 to 13 represent the AB genotype (422, 366 and 56 bp). Small fragments of 28 bp and 56 bp were invisible in the gel. Lanes 1 and 14 show the PBR322/MspI DNA marker.

