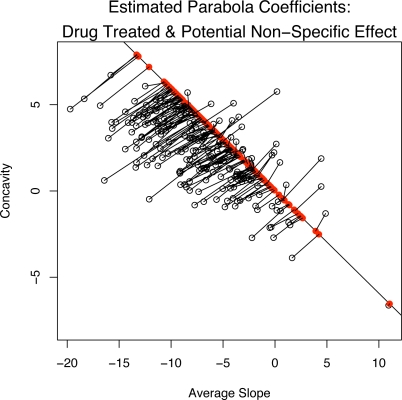
Figure 3:
A plot of the estimated average slope and concavity coefficients (fixed effect plus BLUP) for drug treated subjects and the corresponding projection onto the non-specific effect direction. Note that the projections are not necessarily orthogonal projections onto the non-specific effect direction line.

