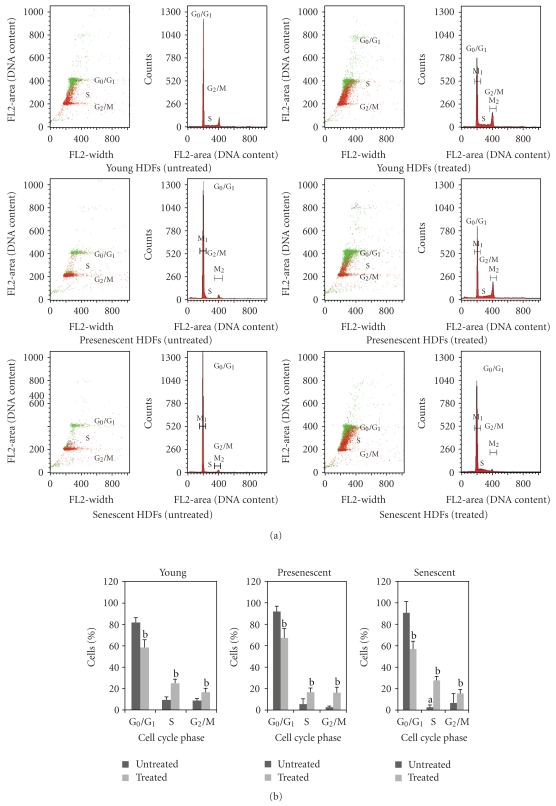
Figure 6.
Analysis of cell cycle progression. Flow cytometric analysis of cell cycle progression in young, presenescent, and senescent HDFs (a). Quantitative analysis of cell cycle progression in untreated and TRF-treated HDFs at various stages of cellular ageing (b). Cell population in the S phase was lower in senescent HDFs. Treatment with TRF significantly increased cells in S phase and G2/M phase for all stages of cellular ageing of HDFs. In contrast, cell populations in G0/G1 phase decreased significantly with TRF treatment. aDenotes P < .05 compared to S phase of untreated young HDFs, bP < .05 compared to untreated HDFs. Data are presented as mean ± SD, n = 6.

