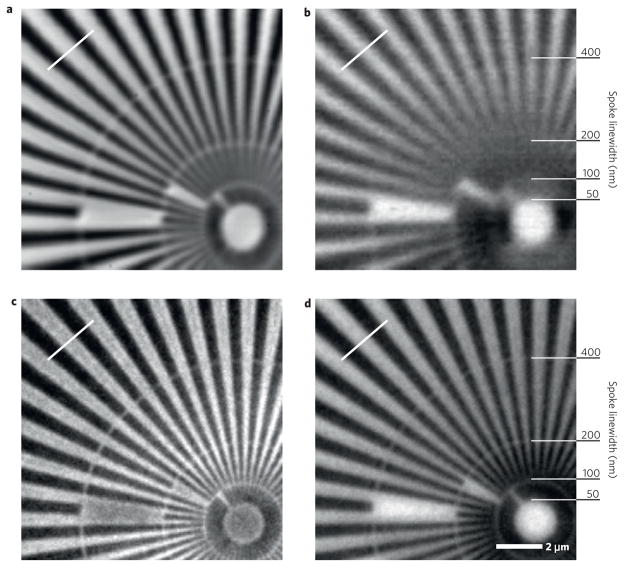
Figure 3. Scanning and full-field images of a gold Siemens star test pattern in Zernike and absorption contrast.
a – d, Zernike phase contrast in scanning (a) and full-field (c) microscopy; absorption contrast for the two cases respectively (b and d). The starting linewidths of the spoke rings are indicated. The white line in each image marks where the contrast was determined.

