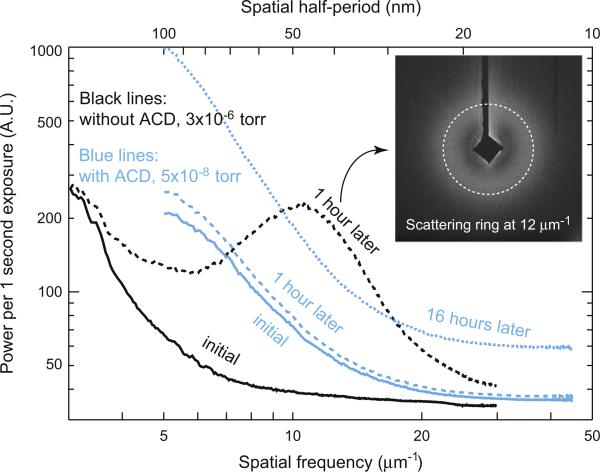
Fig. 4.
The azimuthally averaged curves of diffraction patterns. Black lines, measured with Gatan 630 holder and without ACD at the beginning (black solid) and 60 min later (black dashed). Blue lines, measured with Gatan 914 holder and with ACD at the beginning (blue solid), 60 min later (blue dashed) and 16 h later (blue fine-dashed). The vacuum pressure is improved by ACD. The ACD reduces moisture condensation and amorphous ice formation for up to 16 h. The inset image is the diffraction pattern taken 1 h later without ACD. A ring of scattering signal was observed around a spatial frequency of 12 μm–1. (For interpretation of the references to color in this figure legend, the reader is referred to the web version of this article.)

