. 2011 Feb 14;37(2):189–199. doi: 10.1037/a0021461

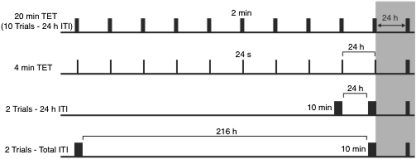
Figure 4. Design of Experiments 2a and 2b. Black bars on the white background represent exposure training trials and black bars on the gray background represent the novelty preference test. The top panel illustrates the time line (not to scale) of trials for the control group used in both Experiments 2a and 2b. In Experiment 2a, performance of the control group (20-min total exposure time [TET]) was compared with a group that received similar training and testing conditions, except that the training trials were a duration of only 24 s (4-min TET, shown in the panel second from the top). In Experiment 2b, performance of the control group (10 Trials–24 h inter-trial interval [ITI]) was compared with two groups that received two 10-min trials separated by either a 24-h interval (2 trials–24 h ITI, shown in second panel from the bottom), or by an interval of 216 h (i.e., 9 days; 2 trials–total ITI, shown in the bottom panel).

Figure 4