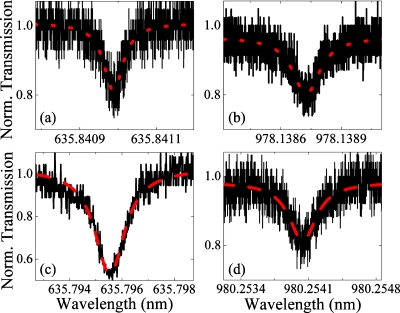
Figure 2.
The measurements of the photon lifetime or Q factor, which indicates the interaction strength between the whispering gallery mode and the lipid bilayer. The quality factor was determined from the full-width at half maximum (FWHM, Δλ) of the Lorentzian fit (dashed red line) to the experimental data (solid black line). This measurement was performed using an undoped lipid bilayer at (a) 633 nm and (b) 980 nm, and using a Cy5 conjugated lipid bilayer at (c) 633 nm and (d) 980 nm.

