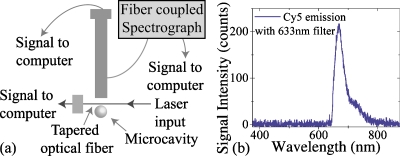
Figure 3.
The fluorescent emission spectra of the Cy5 in the lipid bilayer excited using the microcavity. (a) Schematic of test and measurement setup. The evanescent field of the microcavity excites the Cy5-conjugated lipids, and the emission is detected by the spectrograph. The optical power is fiber coupled into and out of the resonant cavity, and the collected fluorescence signal is fiber coupled into the spectrograph. (b) The emission from the Cy5-conjugated lipid bilayer which is excited by the optical microresonator. The peak maximum is located at 670.11 nm. The 633 nm excitation laser is blocked using a filter.

