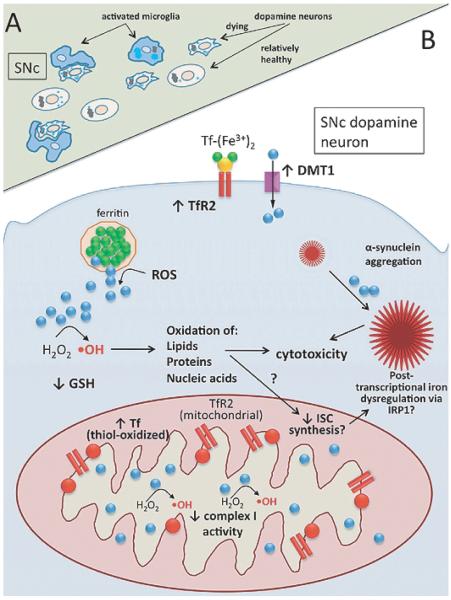
Fig. 4.
Iron dysregulation in Parkinson’s disease. A) Tissue-level view of the substantia nigra pars compacta (SNc) showing suspected ante-mortem pathology: iron-laden (light blue circles), degenerating neuromelanin (black) containing neurons surrounded by activated microglia (blue). B) Subcellular view of nigral dopamine neuron showing pathophysiology and suspected mechanisms of iron dysregulation. Key features: decreased complex I activity; α-synuclein aggregation, exacerbated by iron; increased TfR2 and DMT1 protein levels at plasma membrane; expression of TfR2 in nigral mitochondria; accumulation of oxidized Tf (red) in mitochondria – with associated reductive release of ferrous iron (blue); ROS-mediated release of ferrous iron from ferritin; Fenton chemistry (hydroxyl radical formation, ·OH); decreased levels of reduced glutathione (GSH).

