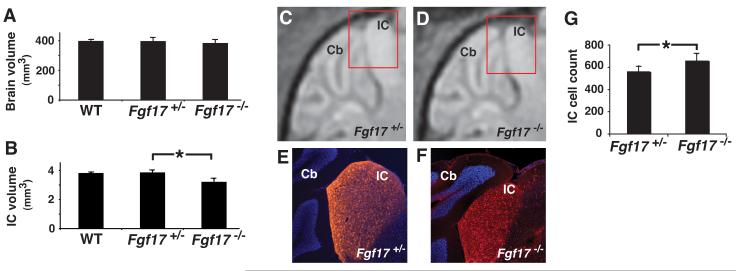
Fig 2. MEMRI and histology confirmed the reduction of IC in Fgf17−/− mice.
3D MEMRI images of the brain and IC allowed quantitative volumetric analysis. Quantitative analysis showed no difference between the whole brain volumes of WT (N=4), Fgf17+/− (N=14) and Fgf17−/− mice (N=14) (A), or between the IC volumes of WT and Fgf17+/− mice, while the IC volume in Fgf17−/− was significantly reduced compared to Fgf17+/− mice (B; *p=0.0001). This reduction in IC size was also evident in sagittal MEMRI images (C,D) and matched histological (E,F), using Neurogranin (red) staining to identify the IC nuclei (A,B). Nuclear DAPI (blue) staining was used as a counterstain, highlighting the adjacent cerebellum (Cb). The red inset boxes (C,D) show the approximate position of the histological sections (E,F) relative to the MEMRI images. Quantitative analysis showed a significant increase in the number of cells per unit area in 3 slices of the central IC, comparing Fgf17+/− (N=3) and Fgf17−/− (N=3) mice (G; *p=0.026).

