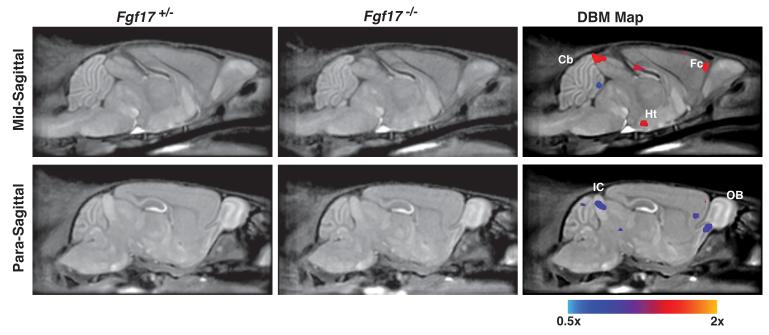
Fig 3. DBM analysis revealed morphological differences in Fgf17−/− mice.
Slices through 3D MRI datasets show the average Fgf17+/− and Fgf17−/− images, respectively, in the left and middle column. In the right column, statistically significant voxel size changes are highlighted (5% false discovery rate, FDR). The color scale indicates regions that were significantly larger (red/yellow; scale goes up to 2×) or smaller (blue; scale goes down to 0.5×) in the Fgf17−/− mice compared to the Fgf17+/− control littermates. Labels: cerebellum, Cb; frontal cortex, Fc; hypothalamus, Ht; inferior colliculus, IC; olfactory bulb, OB.

