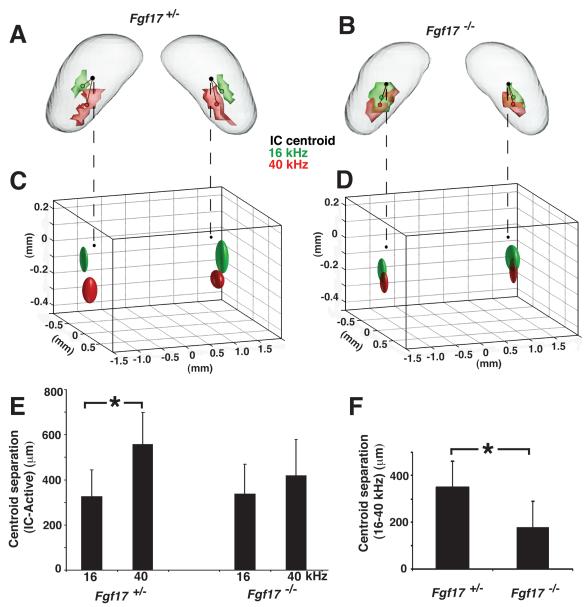
Fig 5. MEMRI demonstrated an altered tonotopic map in Fgf17−/− IC.
16- (green) and 40-kHz (red) activity patterns and centroids (small green and red circles) were measured in the IC of Fg17+/− (A) and Fg17−/− (B) mice. The 16- and 40-kHz activity patterns were separated along the dorsal-ventral tonotopic axis in the IC of Fgf17+/− mice, but largely overlapped in Fgf17−/− mice. Likewise, ellipsoids representative of the population variability showed the normal separation in Fgf17+/− mice (C), but not Fgf17−/− mice (D). Quantitative analysis comparing the distance from each activity centroid to the IC centroid (small black circles) showed a significant difference in the two frequencies in Fgf17+/− mice, but not in Fgf17−/− mice (E; *p=0.0057). There was also a 49% reduction in the separation between the 16- and 40-kHz centroids in Fgf17−/− mice compared to Fgf17+/− mice (F; *p= 0.0074).

