Fig. 3.

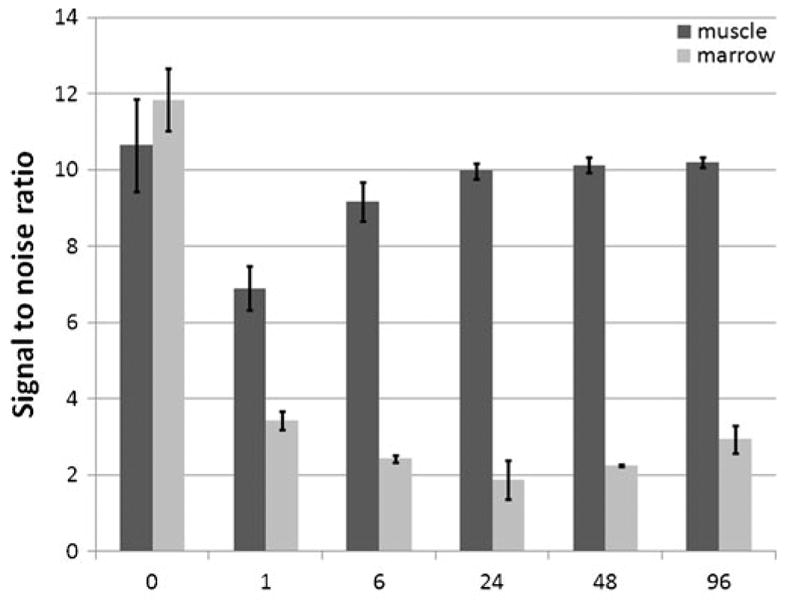
Quantification of signal changes in muscle and bone marrow immediately before MPIO injection (time=0) and several time points following injection of 100-μg iron. Error bars are standard deviations between three animals.

Quantification of signal changes in muscle and bone marrow immediately before MPIO injection (time=0) and several time points following injection of 100-μg iron. Error bars are standard deviations between three animals.