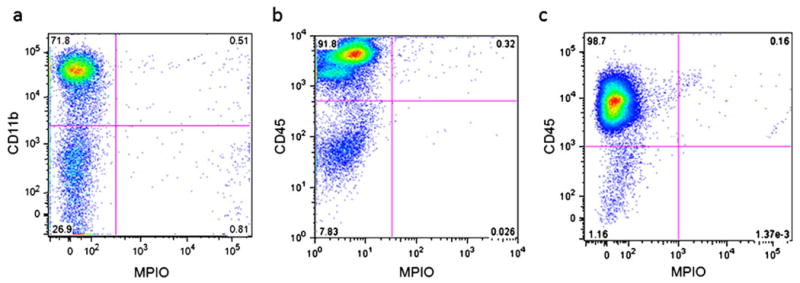
Fig. 5.

a Flow cytometry for CD11b, a marker for monocytes, and b CD45, a marker for cells of the hematopoietic lineage, at 2 days post-injection. c Flow cytometry for CD45 at 7 days post-injection. All plots are shown with green fluorescence from MPIOs on x-axis.
