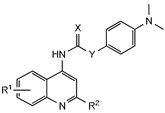
Table 2.
Activity of 4-dimethylaminophenyl quinoline ureas against OX1R and OX2R.
 | ||||||
|---|---|---|---|---|---|---|
| No. | R1 | R2 | X | Y | Ke (nM) | |
| OX1a | OX2b | |||||
| 24 | 8-F | H | O | NH | 2.4±1.7 | 171±25 |
| 25 | 8-F | Me | O | NH | 65±33 | >10,000 |
| 26 | 8-F | H | S | NH | 1115.1 | >10,000 |
| 27 | 6-CF3 | H | O | NH | >10,000 | >10,000 |
| 28 | 8-CF3 | H | O | NH | 131±33 | >10,000 |
| 29 | 8-F | H | O | CH2 | >10,000 | >10,000 |
values are the mean of at least three independent experiments in duplicate.
values are the mean of at least two independent experiments in duplicate
