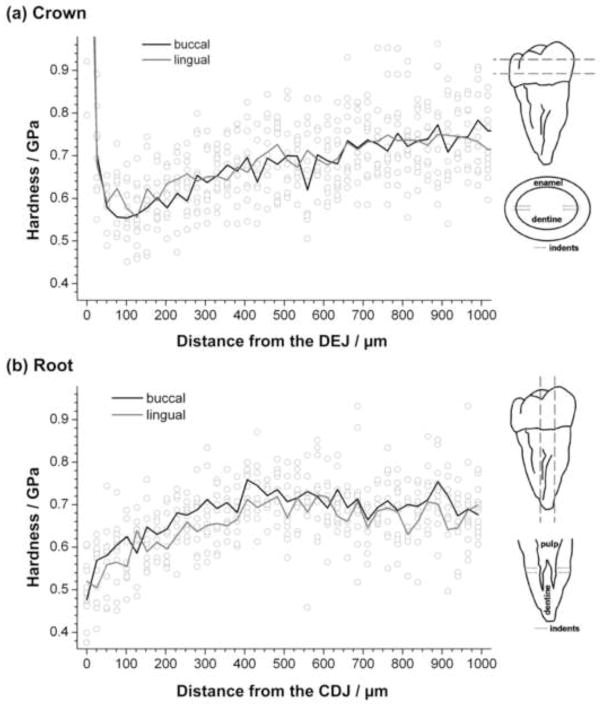
Figure 1.
Results of microindentation experiments on dry (a) crown and (b) root dentine. Hollow circles indicate each single indentation results, while the lines indicate average values from 3 independent tooth samples for buccal (black) and lingual (grey) sides of teeth. Diagrams illustrate sectioning of and indentations on crown (top) and root (bottom) samples.

