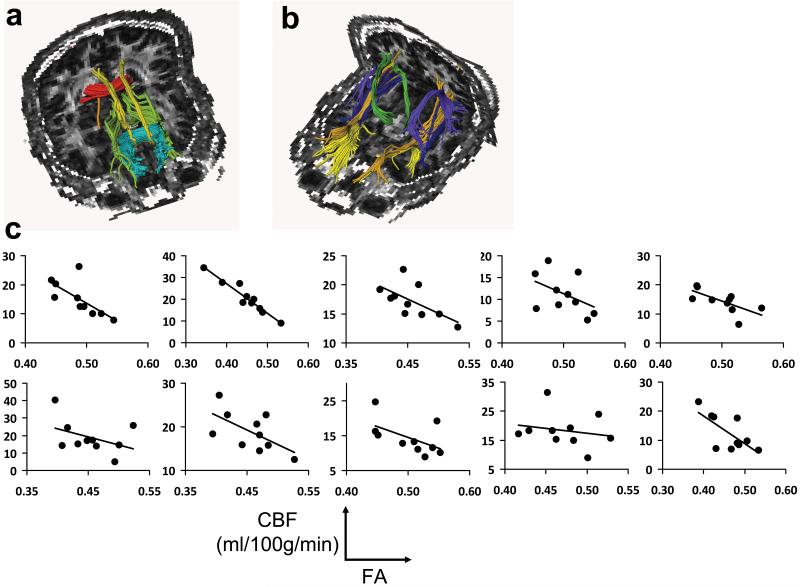
Figure 2.
Relationship between tract-specific FA and CBF. (a,b) Illustration of ten major fiber tracts overlaid on FA maps. For clarity, five fibers are shown in (a) and five are shown in (b). The fibers in (a) are: forceps major of the corpus callosum (red), forceps minor of the corpus callosum (blue), cingulum in the cingulate cortex (yellow), cingulum to hippocampus (orange), and anterior thalamic radiation (green). The fibers in (b) are: uncinate fasciculus (yellow), corticospinal tract (green), arcuate fasciculus (pink), inferior fronto-occipital fasciculus (blue), and inferior longitudinal fasciculus (orange). (c) Scatter plots between FA and CBF across fiber tracts. Each sub-plot displays data from one subject. Within a sub-plot, different points indicate different tracts. An inverse correlation is observed in all subjects. In statistical analysis, the cc values from the sub-plots are combined in a meta-analysis to yield a t statistic.

