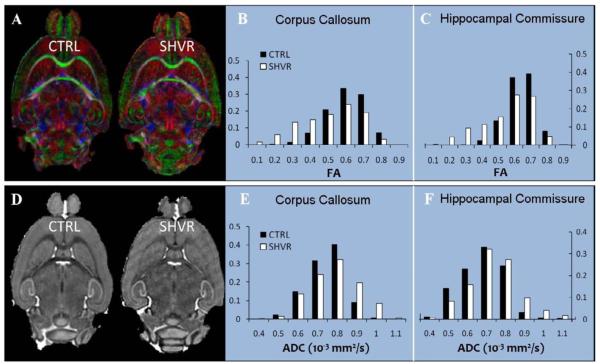
Figure 5.
Intact fiber tracts in the shiverer mice with slightly decreased diffusion anisotropy and increased ADC. (A) A representative slice of color-coded FA map in the control mouse and in the shiverer mouse. The color coding scheme is: red representing rostrocaudal direction, green representing left-right direction and blue representing dorsoventral direction. The color-coded FA maps demonstrate identical fiber orientations in the shiverer as in the control. (B) Comparison of the histograms of FA in the corpus callosum and (C) in the hippocampal commissure reveal slightly decreased FA in the shiverer mouse. (D) A representative ADC map of the control mouse and the shiverer mouse demonstrate a reduced ADC contrast in the shiverer. (E) Comparison of the histograms of ADC in the corpus callosum and (F) in the hippocampal commissure show increased ADC in the white matter of shiverer mice.

