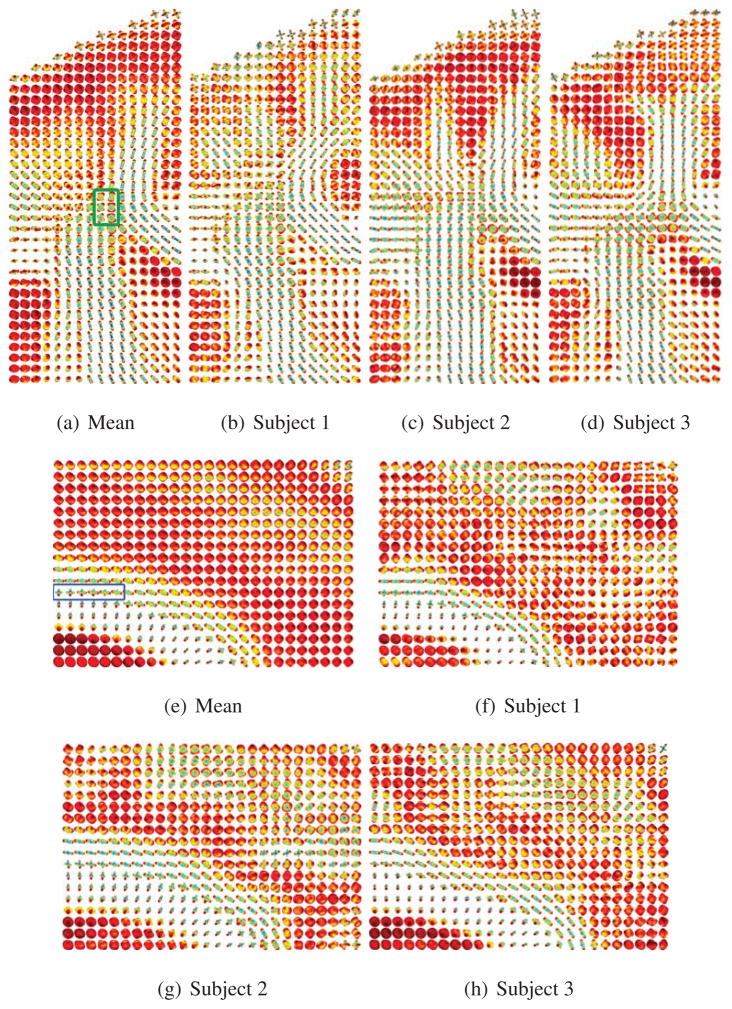
Figure 13.
Comparing the mean ODF to the ODF of individual subjects. Figs. 13(a)–13(d) correspond to the ROI of the cortical spinal tract and corpus callosum. The ROI in green corresponds to the two fiber tracts crossing. Figs. 13(e)–13(h) correspond to the ROI of the cingulum and the corpus callosum. The ROI in blue corresponds to the voxels exhibiting partial volume averaging of the two fiber tracts.

