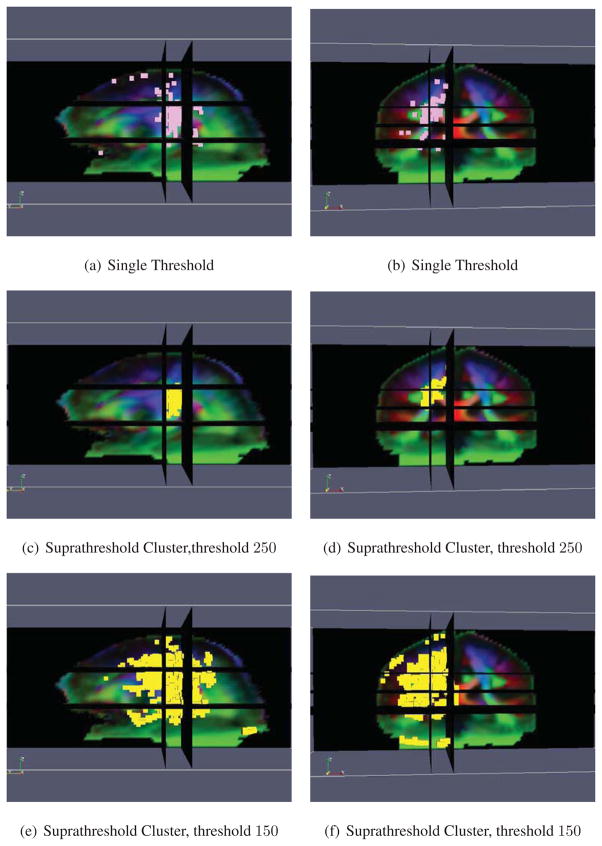
Figure 15.
Results of performing the ODF Euclidean statistical test on brain asymmetry. Figs. 15(a), 15(c) and 15(e) show the sagittal view and Figs. 15(b), 15(d) and 15(f) the coronal view. The pink voxels in Figs. 15(a) and 15(b) are deemed significant by the single threshold test and the yellow voxels in Figs. 15(c)–15(f) are deemed significant by the suprathreshold cluster test.

