
Figure 10.
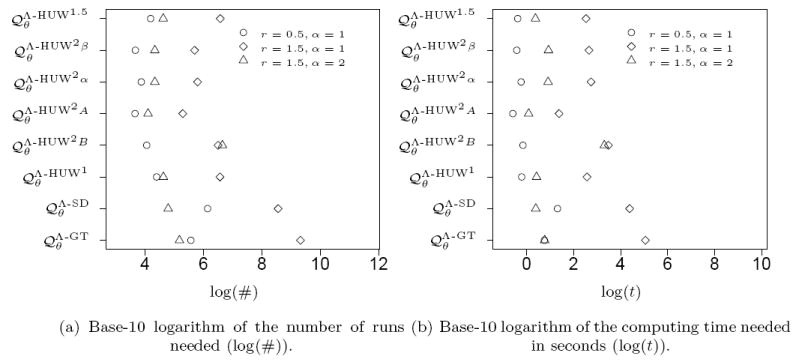
Number of runs and computing time needed to obtain a relative error below 1% for the trees of high relative complexity given in Figure 8.
Official websites use .gov
A
.gov website belongs to an official
government organization in the United States.
Secure .gov websites use HTTPS
A lock (
) or https:// means you've safely
connected to the .gov website. Share sensitive
information only on official, secure websites.
Number of runs and computing time needed to obtain a relative error below 1% for the trees of high relative complexity given in Figure 8.