
Figure 7.
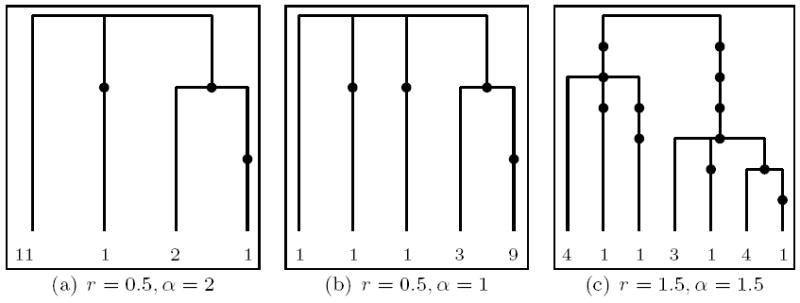
Trees showing an average number of mutations out of 500 simulated trees under the respective parameters (leaf labels correspond to type multiplicities).
Official websites use .gov
A
.gov website belongs to an official
government organization in the United States.
Secure .gov websites use HTTPS
A lock (
) or https:// means you've safely
connected to the .gov website. Share sensitive
information only on official, secure websites.
Trees showing an average number of mutations out of 500 simulated trees under the respective parameters (leaf labels correspond to type multiplicities).